The Yonkers Ledger 2026 School Report Card shows a Yonkers school district making meaningful progress while still facing significant challenges (see the full report card here). The most recent publicly available data shows real gains in reading, while math proficiency remains stubbornly below the state average. Yonkers also grapples with high absenteeism and wide differences in outcomes among its schools. Yonkers doesn’t pass or fail, get an A or a D. It’s a system that has many grades: outcomes that vary widely by subject, school and attendance.
Our report card is based on test results from the 2024-25 school year. Results from 2025-26 should become public in November (you can get a preview of the 2025-26 results in this Back to School story).
Test scores don’t mean everything. Educational trends come and go; two decades ago the emphasis was on testing, more recently schools have backed away. The mission of schools is to prepare students for life and to promote their happiness and well-being. That can’t be measured with standardized tests. Yet as imperfect as they are, tests remain one of the few tools to compare one school to another, one grade to the next, one year to the last.
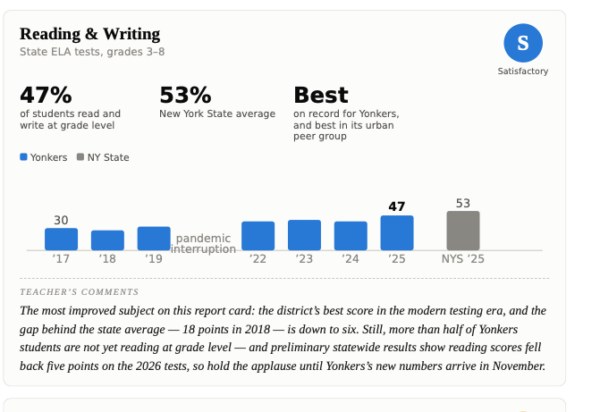
Reading Improves the Most, Starts to Catch Up to State level
The clearest good news is reading. Approximately 47% of Yonkers students in grades three through eight met state grade-level standards for English language arts, rising substantially from 30% in 2017. The improvement has brought proficiency much closer to the state level of 53%.
A teaching model that has evolved in recent years may partly explain the reading gain, according to Michelle Yazurlo, Yonkers’ associate superintendent in the district’s division of teaching and learning. The gains in reading, she says, have come through following a “three-tiered” teaching model that relies greatly on assessment: lessons adjust according to the pace of student learning.
Math is the more persistent problem. In grades three through eight, 46% of Yonkers students met state math standards in 2024-25. That’s 11 percentage points below the state average of 57%. The gap is particularly pronounced by eighth grade, when just 38% of students met the state math standard. “We know there is a gap with math and that is something we are strategically working on,” Yazurlo says.
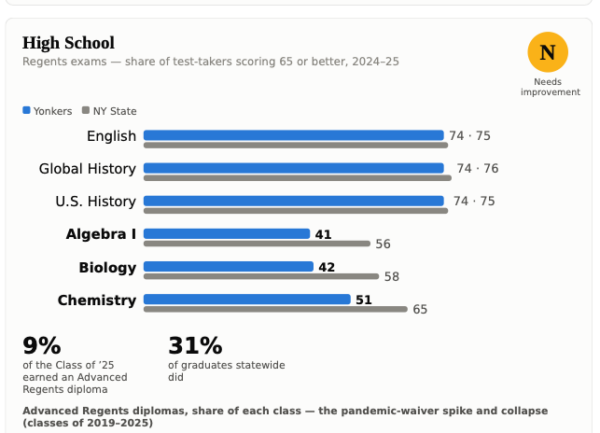
The disparity in math continues into high school, where only 41% of Yonkers test-takers passed their Algebra I Regents exams, compared with the 56% who passed statewide. Biology and chemistry show similar disparities. In English, global history and U.S. history, by contrast, Yonkers’ students roughly match the state.
High School Regents Scores Low in Math and Science
A passing score on the Regents does not necessarily equate to subject mastery — the passing grade is 65. In Algebra I, 41% of Yonkers test-takers passed, but only 4% scored 85 or higher, compared with 12% statewide. The district’s Regents diploma with advanced designation tells a similar story: just 9% of the Class of 2025 earned the more demanding credential, compared with 31% statewide.
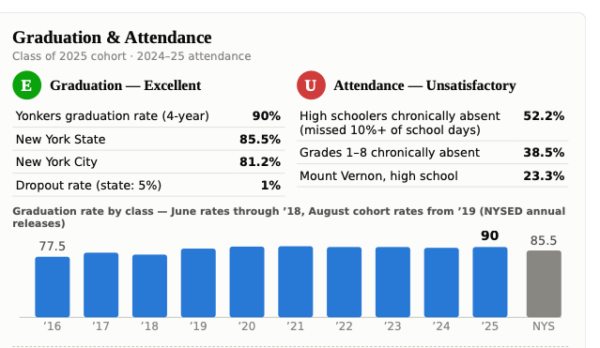
Yonkers students face many challenges in the long journey from prekindergarten to graduation, but in the end the vast majority leave with a diploma. In the Class of 2025, 90% graduated within four years, compared with 85.5% statewide. That rate has remained near 90% for Yonkers in recent years, rising from 83% in 2016.
A high graduation rate is a major win for the schools, according to Stephen Sireci, an educational testing expert at the University of Massachusetts Amherst, where he heads the Center for Educational Assessment. “Graduating high school in New York involves a lot of things,” he says. “Performance in tests is part of it, but it’s not the whole picture. I think a high graduation rate is something that Yonkers can be proud of.”
Chronic Absenteeism: Students Often Miss Class, Still Graduate at a High Rate
Yonkers may be at the top of its class in graduation rate, but another aspect of high school life offers a puzzling counterpoint — chronic absenteeism. The 2024-25 data shows that 52% of Yonkers high school students were chronically absent, meaning they missed at least 10% of school days, or at least 18 days in the 180-day school year. The Yonkers rate is much higher than the 23% rate in Mount Vernon and the 37% in New Rochelle.
“Eighteen days a year is almost a day a week. The absentee rates are shockingly high,” Sireci says. “The more time these kids spend in school, the more they are going to learn. When you ask what we can do to increase proficiency rates, it’s probably to decrease the absentee rates.”
Absenteeism at the Yonkers elementary level is also higher than at nearby districts. The Yonkers rate of 38% in grades one through eight tops New Rochelle’s 26% and Mount Vernon’s 22%. And as with academic results, high school attendance represents a sharp worsening from the lower grades, and an area where the Yonkers schools fall further behind other neighboring districts.
“Sometimes students can’t physically get to the school because of extenuating circumstances,” says Ida D’Ugo, a former Yonkers teacher, now a Yonkers-based educational consultant. “At the high school level, I know students often miss class in the morning because they are caring for younger siblings, and that doesn’t come up in any of the data you see. If there isn’t enough communication between the school and families, it’s a struggle. Parents are not always aware of the importance of attendance. More family and community engagement would help.”
Profile of the District
We grade Yonkers based on the test scores, but the context shouldn’t be ignored. Yonkers serves a large low-income student population: 74% of students are classified as low-income, and 21% are identified as having disabilities. It’s a district that’s 63% Hispanic or Latino, and 15% of the students are English language learners. Educators say those circumstances can shape how often and whether students are able to attend school.
The district-wide averages also mask striking differences from one school to another. At PEARLS Hawthorne, a local gifted and talented magnet school, 89% of tested students met grade-level standards in both reading and math. At William Boyce Thompson, 37% met the reading standard and just 20% met the math standard. At several other schools, math proficiency was below 35%. Attendance varies just as widely among high schools, from 32% chronically absent at Saunders Trade and Technical High School to 69% at Gorton High School.
The differences raise a central question: What accounts for such different outcomes within the same district? Yazurlo says Yonkers is a “district of choice.” This means parents request specific schools for their students to attend. While she acknowledges there are differences from school to school, she says the district is working to even out any inconsistencies so that every school stands out. “Making all the schools quality and choice schools is a goal,” Yazurlo says.
So how does Yonkers compare with other cities? We’re most often compared with the Big 5, which includes Yonkers and the four other big city districts: New York City, Buffalo, Rochester and Syracuse. The district outscores Buffalo, Rochester and Syracuse on reading and math and has a far better graduation rate.
Can Progress Continue as Enrollment Drops?
But the comparison flatters. Buffalo and Rochester are the state’s most distressed districts, where more than 70% of high schoolers are chronically absent. Comparison with other Westchester cities cuts the other way: New Rochelle and White Plains post better scores and a fraction of the absenteeism, but they are smaller, wealthier districts with far less poverty and fewer English learners. The closest real match is across the city line, in the Bronx. New York City’s Geographic District 10 — Kingsbridge, Riverdale, Fordham — is poorer than Yonkers and nearly twice its size. Against that district Yonkers is modestly ahead on tests and graduation, and far behind on attendance, 52% to 33%.
The honest evaluation? The numbers show a district that has made meaningful progress. Yonkers has clear areas of success: a strong graduation rate and substantial improvement in reading. But beneath those positive indicators are persistent concerns about academic proficiency across grade levels, absenteeism, and uneven outcomes from school to school. Yonkers is not a district in crisis, or one that has solved all its challenges. Fiscal crises in past years caused instability and program cuts. Money remains a big problem, even as the enrollment drop reshapes the schools. The challenge now is to turn the progress seen in some parts of the district into progress that is consistent across all of it.